

Descriptive statistics
Descriptive statistics are presented in Table 1. The sample mean for SGTI (CoCite) is 0.05, with a maximum value of 7.19 and a median of 0. Few firms actively participate in SGTI, with substantial variation in innovation levels observed. The minimum value of the environment cognitive distance is 0, the maximum value is 8.35, and the average is 1.12. Indicating a significant gap in environmental awareness levels among the different companies in the sample. The minimum value of the R&D capability distance is 0, the maximum value is 24.21, the average is 2.78, and the median is 1.68. This shows that more than half of the firms have an R&D capability distance exceeding the average, highlighting significant disparities in R&D capability among supply chain members.
Regression results
Table 2 presents the baseline regression results for Equ. (1 and 2). Column (1) shows the regression results with only control variables included. Column (2) shows that the environmental cognitive distance has a significant negative effect on SGTI (β = −0.02, p < 0.1), supporting Hypothesis 1. Column (3) indicates that the R&D capability distance has a significant positive effect on SGTI (β = 0.01, p < 0.1), supporting Hypothesis 2. Column (4) examines the moderating effect of environmental cognitive distance on the relationship between R&D capability distance and SGTI. The results show that as environmental cognitive distance decreases, the positive effect of R&D capability distance on SGTI becomes more significant (β = −0.01, p < 0.05), supporting Hypothesis 3. Figure 2 illustrates the moderating effect of environmental cognitive distance, showing that lower environmental cognitive distance enhances the positive effect of R&D capability distance on SGTI, while higher environmental cognitive distance weakens this effect.
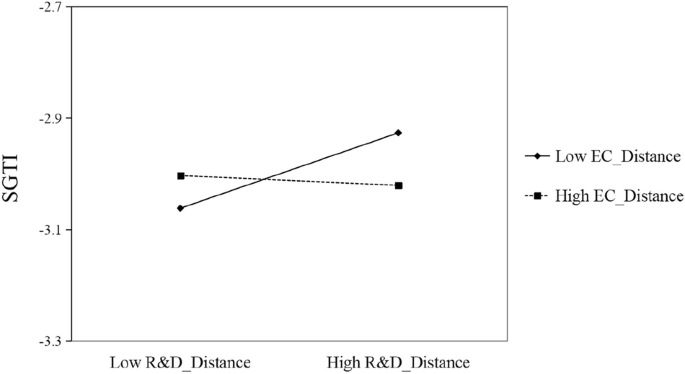
The moderating effects of environmental cognitive distance on the relationship between R&D capability distance and SGTI.
Robustness tests
PSM-DID
This paper uses a difference-in-differences (DID) model to estimate the difference in SGTI before and after the change in cognitive distance. The specific model is as follows:
$${CoCite}={\beta }_{0}+{\beta }_{1}{DID}+\gamma {{Control}}_{s,t}+{Year}+\varepsilon$$
(3)
The sample is divided into high and low groups based on the year-industry average value of environmental cognitive distance. For pairs with high environmental cognitive distance, the value of Treated is set to 0, serving as the control group. For high-low pairs, Treated is assigned a value of 1, serving as the treatment group. After is a dummy variable indicating the change in the environment cognitive distance group, taking a value of 1 for the year in which the cognitive distance first exceeds a certain threshold and all subsequent years, and 0 otherwise. The DID is the product of Treated and After. Additionally, since differences between the treatment and control groups in terms of environmental cognitive distance may lead to selection bias, reducing the validity of the model’s estimation, this paper uses propensity score matching (PSM) for 1:2 nearest neighbor matching before the DID analysis. The PSM-DID steps for R&D capability distance are the same as above. The results are shown in Table 3. Model (1) shows the relationship between environmental cognitive distance (DID_Cognition) and SGTI, with the results indicating a significant negative correlation (β = −0.02, p < 0.1). Model (2) shows that the R&D capability distance (DID_Capability) is significantly positively correlated with SGTI (β = 0.00, p < 0.1). These results are consistent with previous regression results, indicating the robustness of the conclusions.
Change variables
To further verify the reliability of the research results, this paper conducts robustness checks using alternative variables. First, to prevent the length of the MD&A disclosures from affecting the measurement of environmental cognition, we replace the measurement of environmental cognition with the ratio of the number of “environment” keywords to the total number of words in the MD&A. After standardizing this by year and industry, we take the absolute value of the difference to measure environmental cognitive distance. The results, shown in Table 3 model (3), indicate that the impact of the environmental cognitive distance (EC_Distance(words)) on SGTI remains significantly negative (β = −0.08, p < 0.1). This suggests that the result for H1 is robust.
Second, we use the number of R&D personnel as a measure of R&D capability. The R&D capability distance is the absolute value of the difference in the year-industry standardized number of R&D personnel. The results, shown in Table 3 model (4), indicate that the R&D capability distance (R&D_Distance(employee)) has a significant positive correlation with SGTI (β = 0.12, p < 0.1). These results confirm the robustness of H2.
Finally, we include the digital transformation as control variable. Research has found that digital technologies can promote information sharing and collaboration among supply chain members (Wang and Zhang, 2024), and therefore may have an impact on SGTI. In this study, we use Python to analyze the frequency of keywords related to artificial intelligence, big data, cloud computing, blockchain technology, and digital technology in the corporate annual reports (Wu et al., 2021). The results, shown in model (5 and 6) of Table 3, indicate that the environmental cognitive distance has a significant negative effect on SGTI (β = −0.02, p < 0.1). R&D capability distance has a significant positive effect on SGTI (β = 0.1, p < 0.1).
Further analysis
We analyze three moderating factors: (1) firm ownership type (state-owned vs. non-state), (2) supplier rights protection, and (3) geographic co-location of supply chain members. First, ownership type indicates whether supply chain members are SOEs. China’s 2024 Government Work Report underscores its green supply chain agenda: “Promote research and adoption of energy-saving technologies and accelerate green, low-carbon supply chain development.” SOEs are required to undertake certain political tasks (Teece, 2022). Therefore, SOE participation in supply chains strengthens SGTI outcomes. Second, supplier rights protection fosters trust and long-term collaboration within supply chains. Proactive firms often codify environmental standards in supplier contracts to incentivize sustainability (Chen and Ho, 2019). Lastly, geographic co-location aligns members under shared institutional pressures (Li and Liu, 2024) and organizational norms (Wang and Zhang, 2024). This alignment reduces environmental, cognitive, and R&D capability distances, amplifying their collective impact on SGTI.
Property rights
SOEs exhibit greater commitment to green innovation than private firms (Lin and Xie, 2023). First, SOEs need to take special government responsibilities. China’s Dual Carbon Strategy positions SOEs as pivotal actors in advancing green economic and societal transitions. Second, as important tools for the government to address market failures in technological innovation, SOEs undertake more fundamental research, resulting in more significant knowledge spillover effects (Teece, 2022).
This study calculates the number of SOEs within firm pairs as a measure of property rights. Specifically, if neither party in the pair is a SOEs, it is coded as 0; if one party is a SOEs, it is coded as 1; and if both parties are SOEs, it is coded as 2. The regression results shown in Table 4 (1) and (2) indicate that SOEs enhance the negative correlation between environmental cognitive distance and SGTI (β = −0.14, p < 0.01) and promote the positive correlation between R&D capability distance and SGTI (β = 0.03, p < 0.05).
Supplier or customer rights protection
When choosing partners, companies consider not only indicators such as financial status, profitability, and market presence, but also the company’s attitude towards protecting supplier rights. Actively disclosing information about supplier rights protection signals to suppliers that their needs and rights are valued, which can generate positive expectations. Moreover, in order to coordinate environmental practices within the supply chain, more environmentally conscious companies often impose higher expectations, standards, or contract terms on suppliers and incentivize sustainable behavior (Chen and Ho, 2019). Therefore, it is posited that supplier or customer rights protection can lead to greater alignment in environmental cognition among supply chain members, thereby promoting SGTI. Additionally, firms with differing R&D capability often require more commitments from their counterparts to avoid issues like power imbalances or free-riding behaviors. Consequently, A higher level of protection for supplier or customer rights can strengthen cooperation among members, allowing even companies with large differences in R&D capability to engage in green technology collaborative innovation.
This study measures supplier or customer rights protection using the number of times supplier and customer rights protection are disclosed in the CSR reports from CSMAR. The final supplier or customer rights protection index is obtained by adding the instances of supplier or customer rights protection from both companies. The regression results, as shown in Table 4 (3 and 4), indicate that supplier or customer rights protection enhances the negative correlation between environmental cognitive distance and SGTI (β = −0.14, p < 0.01). However, supplier or customer rights protection does not have an effect on the relationship between R&D capability distance and SGTI. This may be because supplier or customer rights protection does not play a substantial role in bridging the R&D capability distance. For instance, when a company’s R&D capability is too low, high R&D capability firms may not be able to engage in collaborative innovation.
Supply chain members from the same region
Regional differences in institutional environments can influence organizational behavior and strategic choices. As businesses are deeply rooted in their social, cultural, and political contexts, which often reflect broader cultural norms (Xie et al., 2023; Liang and Yang, 2024). Whether companies are from the same region may affect the environmental cognitive distance between them. Additionally, in many parts of China, local governments implement various green technology development policies to boost the economy, including initiatives encouraging high R&D capacity firms to lead and support the collaborative development of small firms. Consequently, businesses from the same region are likely to engage in collaborative support when there is a significant distance in R&D capability.
This study uses a dummy variable (City) to indicate whether the supply chain members are from the same city. A value of 1 is assigned if the members are from the same city; value of 0 is used for the rest. The regression results are shown in Table 4 (5 and 6). The results indicate that supply chain members from the same region strengthen the negative relationship between environmental cognitive distance and SGTI (β = −0.35, p < 0.1), and also enhance the positive relationship between R&D capability distance and SGTI (β = 0.20, p < 0.05).
link